
Stats for baseball fans: the single metric for offense is OPS.
By Courtney Perigo, Senior Vice President, Director of Data Strategy & Utilization
With baseball season wrapping up, I wanted to take a moment to talk about how I fell in love with the game this summer. It happened because I merged something I love (statistics) with something that only mildly intrigued me (the Chicago Cubs and Wrigley Field).
Now the story of how I found the Cubs can be its own blog post—it’s filled with a move from the South and the Atlanta Braves to a new job and living walking distance to Wrigley Field. I’ll write that book someday.
But, today’s blog is about using statistics to be the most informed fan I can be and proving that there is only one statistic you need to focus on to understand the best offensive player on your team. That stat is the on-base percentage plus slugging, known as the OPS.
Moneyball statistics gurus will know metrics like “Wins Above Replacement” or “Value Over Replacement.” Unfortunately, those metrics aren’t available on national TV broadcasts or on any MLB scoreboard. That’s why I wanted focus on the best standard baseball metric for the average fan.
TLDR: The player with the highest OPS statistic on your favorite team is VERY LIKELY the best overall offensive player they have. Cheer loudly when they come up to the plate.
Numbers, Numbers, Everywhere…
Have you been to an MLB ballpark and noticed that the scoreboard is a sea of numbers? AVG, OBP, SLG, OPS – these metrics are consistently reported on baseball cards, in newspapers, on websites and by TV analysts. Do they mean anything?
Turns out they do. Each is an attempt to measure some aspect of hitting that seems important on the surface. SLG is a metric used to understand player power; OBP is a metric to understand how good a player is at getting on base.
As an analyst and data scientist, these metrics fascinate me. As a fan looking to just enjoy the game, they can be confusing. Surely there is one metric I should pay attention to when I want to understand the best batters on the team I’m rooting for.
I like my sports simple – it makes the beer, Cracker Jack and hot dog taste better.
Now, I do realize it’s sometimes very easy to understand your best hitters. Especially when you have a power hitter up like Mike Trout on your team or everyone’s favorite player, Javy Baez of the Chicago Cubs. You can just tell from the fan reaction. That’s great and all, but how can I cut through the noise and focus on players that, pound for pound, score runs for their team?
This is where we turn to stats to help us.
The Problem with Understanding Baseball Stats: Players are Human.
There’s a major problem with using player’s individual performances to understand the value of a statistic. Unfortunately, players get sick, have children, take a few days off, get sent down to the minor leagues, play out of their minds or just have a bad day.
In other words, players are human.
To get rid of pesky human characteristics in our database,* we did a little trick to remove player noise.
Instead of analyzing players, we will analyze teams.
Teams don’t take days off and typically play 162 games a year (when we remove outliers like the 1994 MLB Strike). On average, each team should have a similar number of at-bats and equal opportunity to score runs. Since it is less human and normalized, team level data is the ticket for understanding the importance of a baseball statistic.

Transitioning from player analysis to team analysis normalizes our data and makes this project much easier for a statistician
Offense = Runs.
Dictionary.com defines baseball in this way:
[Baseball is] a game of ball between two nine-player teams played usually for nine innings on a field that has as a focal point a diamond-shaped infield with a home plate and three other bases, 90 feet (27 meters) apart, forming a circuit that must be completed by a base runner in order to score, the central offensive action entailing hitting of a pitched ball with a wooden or metal bat and running of the bases, the winner being the team scoring the most runs.
We care about runs because that is the single most important objective of a player on offense – to hit runners in or turn themselves into a run by reaching home plate. This analysis requires the objective function (y) to be runs. The goal of the analysis is to find a batting statistic that is most correlated to runs. Our hypothesis is that a player’s ability to make themselves score a run (r) as well as bat in a run (rbi) will signal a strong offensive player. How do we capture that in a single metric?
<spoiler> OPS is Most Correlated with Runs. </spoiler>
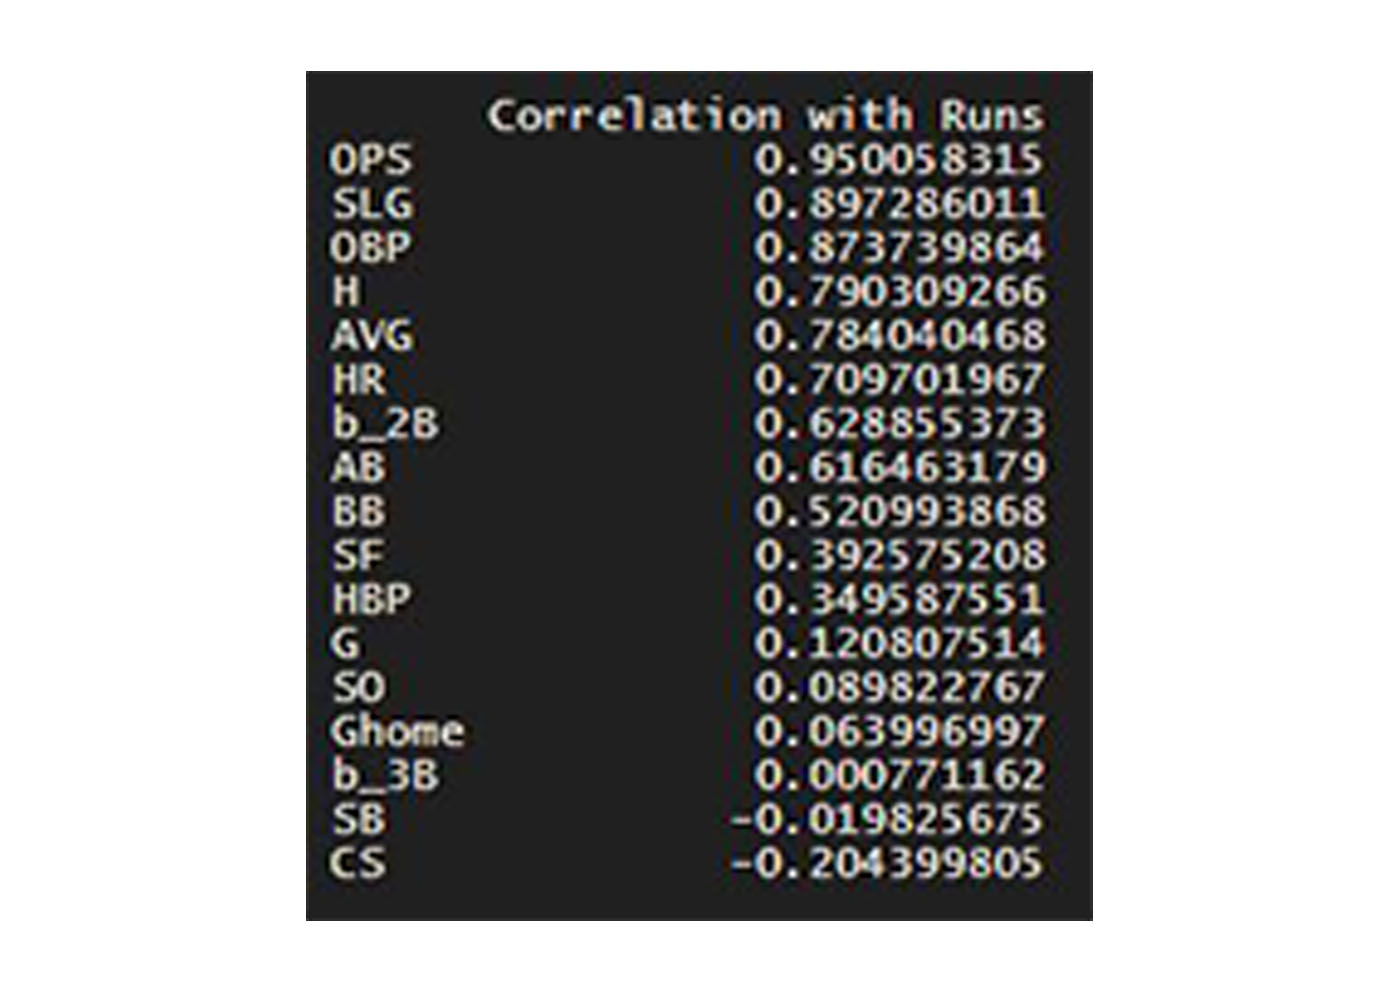
We set off on this analysis by calculating some statistics that you’ll find projected on scoreboards throughout MLB stadiums. Potential metrics include batting average (AVG), slugging percentage (SLG), on-base percentage (OBP), on-base percentage plus slugging percentage (OPS) as well as other common hitting metrics (AB, H, 2B, 3B, HR, etc.).
Some of these metrics we had to create from scratch and their definitions are shown below:
SLG = (hits + doubles + (triples*2) + (HRs*3)) / at bats
AVG = hits / at bats
OBP = (hits + walks + hit by pitch) / (at bats + walks + hit by pitch + sacrifice flies)
OPS = OBP + SLG
Earlier, I mentioned we normalized our data by using team seasonal totals rather than individual player totals. I further normalized by removing some outlier seasons. Below are full details of my team outlier removal:
Removed teams before 1970: Several key metrics weren’t tracked prior to the 1970 season (including sacrifice flies, hit by pitch and others).
Removed team seasons where the number of games played was below 156: This would remove seasons that were cut short by strikes and other schedule oddities. (Goodbye 1994 season.)
Removed teams that do not play in the National or American Leagues: We don’t care about the minor leagues or spring training leagues for this analysis.
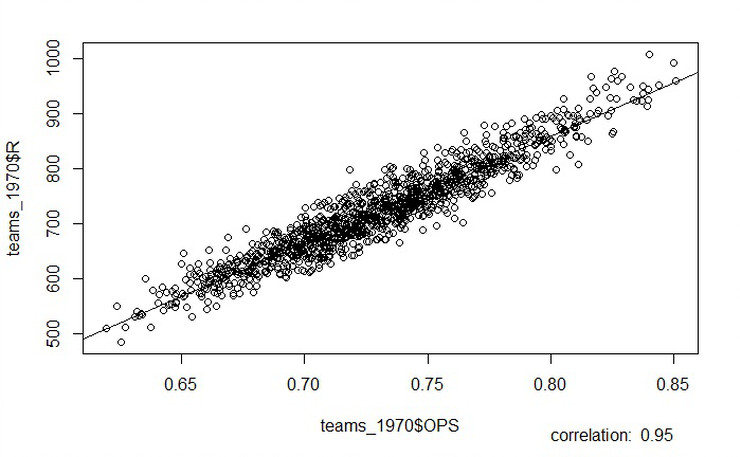
Once we have clean data, we run the analysis that correlates common hitting metrics with runs. The results of the analysis show that OPS is the single most important metric with a correlation of 0.95 (extremely correlated to runs).
Best Players Ever by OPS (with a little help from a Random Forest)
Now that we know that we should pay most attention to OPS, the next question I would ask is who are the best players according to this metric? The answers are easy to calculate…
Actually, they’re not.
Earlier in the post, I mentioned that stats were not kept cleanly for players in certain baseball eras. In 1954, the rule forming the sacrifice fly stat we see today was created. Before 1954, SF was defined differently or not tracked at all by MLB.
So, how are we going to define OPS for players before 1954?
I used a random forest algorithm to predict the player’s missing stats based on stats the MLB did collect. I then used the predicted stats in an estimated OPS for players before 1954. I’m not going to use this blog to showcase the random forest method, but I will show some of the output so you know I did this.
The Random Forest Model
My package of choice was the R library, randomForest. Below is the tuned RF algorithm and output predicting sacrifice flies for players where stats were kept:
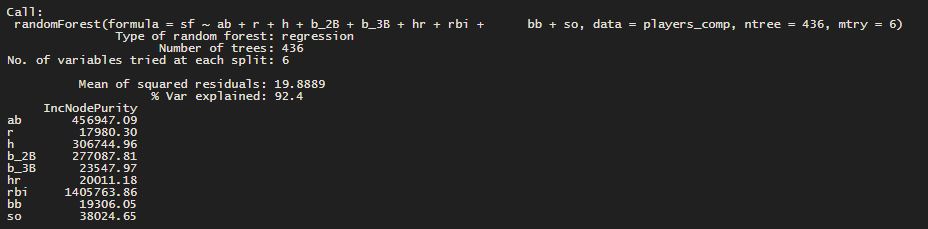
You’ll see that the random forest was extremely effective at modeling sacrifice flies with 92.4% of the variance explained by known hitting variables. I’m super confident that my OPS is reasonable for players before 1954.
Without further ado, below is the list of the top 15 all-time greatest players by OPS, and in my opinion the greatest offensive players ever. My childhood hero, Frank Thomas, makes the cut according to OPS, Mike Trout is the only active player in the top 15 and Babe Ruth is the king of offense… may he reign for a long time.
In Conclusion
OPS is a solid metric that captures two key components of baseball’s offensive strategy.
OBP: The ability of a player to put himself in scoring position.
SLG: The power of a player and their ability to create hits that move players around the bases (including themselves).
My recommendation is to watch out for players who have extremely high OPS stats. They will be your most exciting hitters, usually. According to the data, an OPS of 0.8 is exceptional and I use that as my cutoff to assess players today.

*The Chadwick Baseball-Databank (see this post for more info.)
More Insights
- October 22, 2019 The campaign that keeps on giving.
- October 7, 2019 C-K’s Work/Life: Gary Doyle of So There!
- September 30, 2019 Making a Tony Romo robot is not as easy as it sounds.